Precision Agriculture
- ReconcileMultipleHeaders
- RecreatePassLines
- RemoveFieldEdgePoints
- YieldFilter
- YieldMap
- YieldNormalization
ReconcileMultipleHeaders
Note this tool is part of a WhiteboxTools extension product. Please visit Whitebox Geospatial Inc. for information about purchasing a license activation key (https://www.whiteboxgeo.com/extension-pricing/).
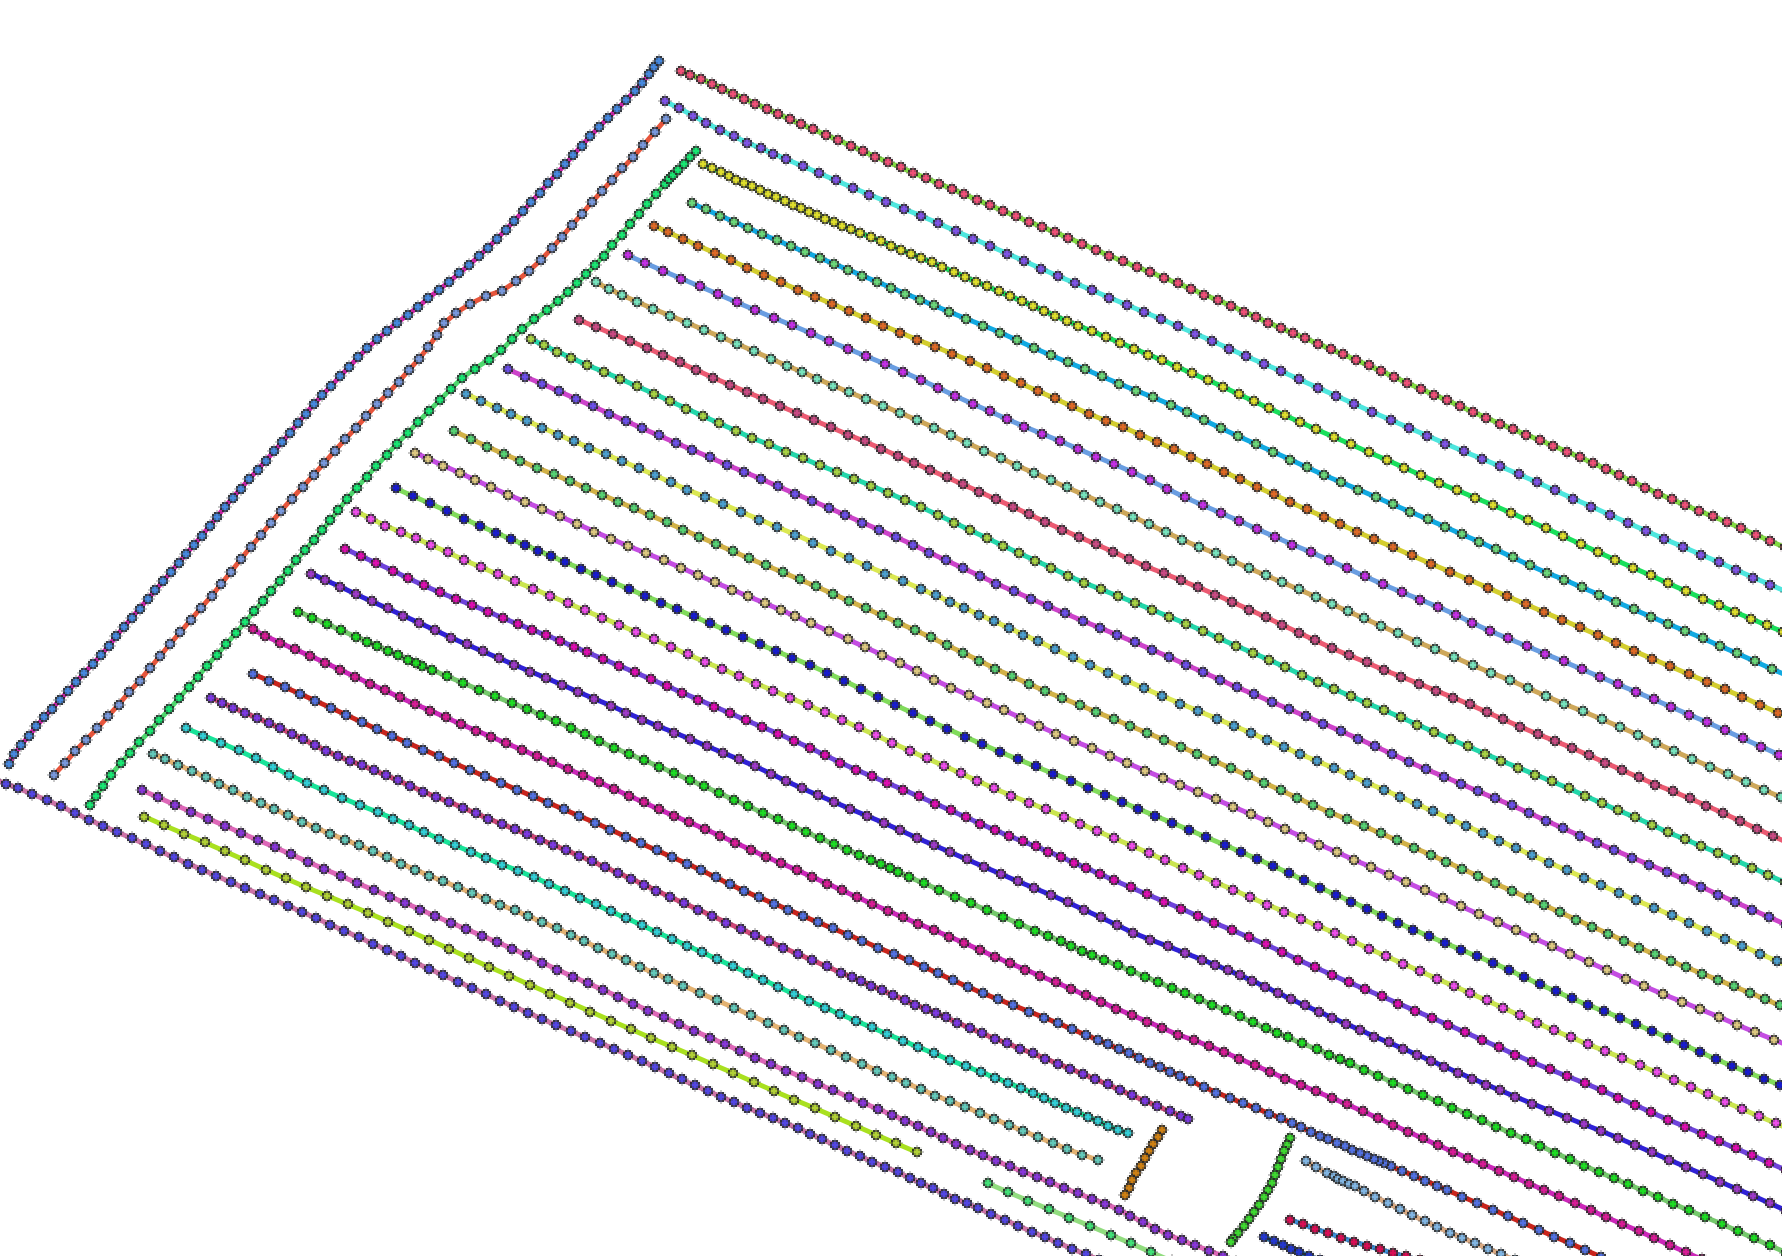
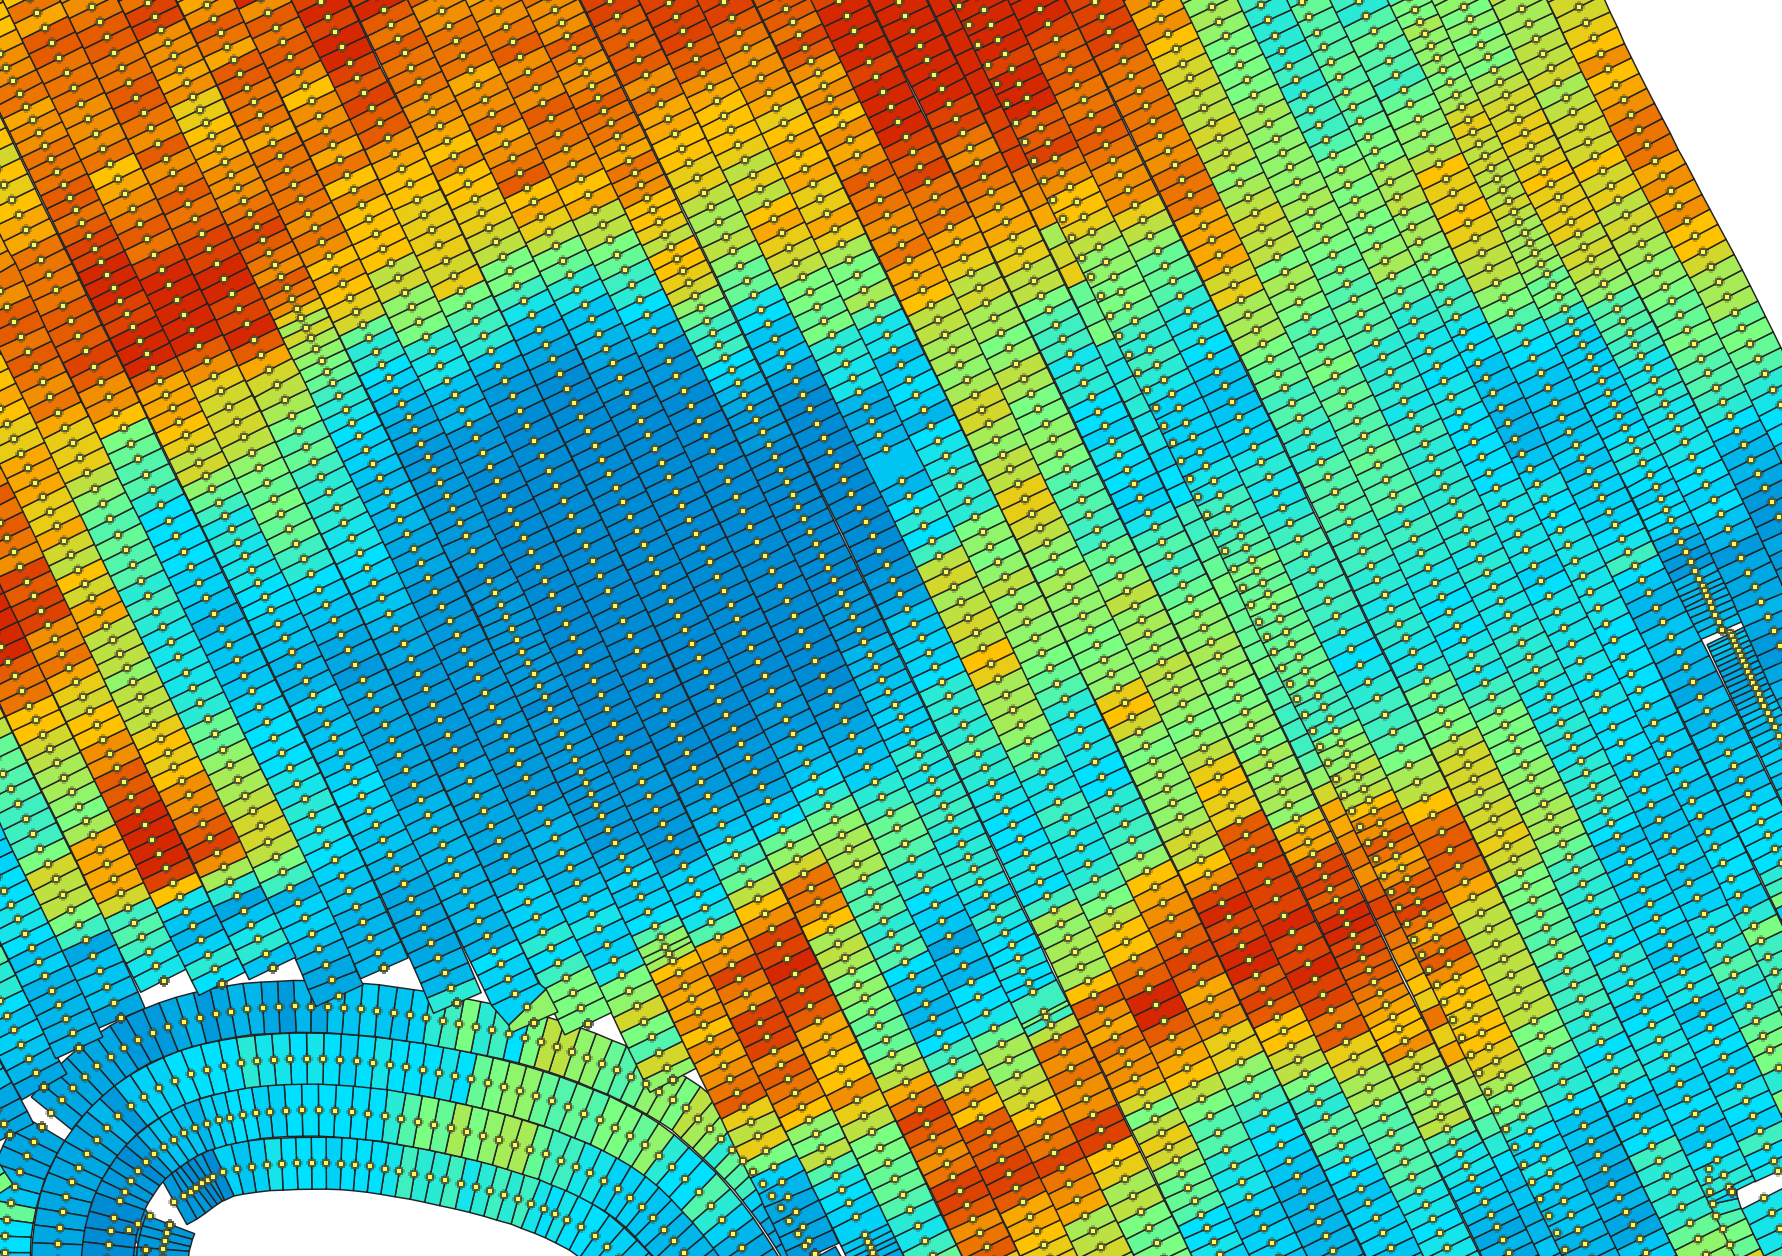
This tool can be used to adjust the crop yield values for data sets collected with multiple headers or combines. When this situation occurs, the spatial pattern of in-field yield can be dominated by the impact of any miscalibration of the equipment among the individual headers. For example, notice how the areas collected by certain equipment (specified by the various random colours) in the leftmost panel (A) of the image below correspond with anomlously low or high yield values in the original yield map (middle panel, B). The goal of this tool is to calculate adjustment values to offset all of the yield data associated with each region in order to minimize the relative disparity among the various regions (rightmost panel, C).

The data collected by a single header defines a region, which is specified by the --region field
in the attribute table of the input vector file (--input). The algorithm works by first locking
the data associated the most extensive region. All non-locked points are visited and neighbouring points within a specified
radius (--radius) are retrieved. The difference between the average of yield values (--yield_field)
within the same region as the non-locked point and the average of locked-point yield values is calculated.
After visiting all non-locked points, the overall average difference value is calculated for each non-locked
region that shares an edge with the locked region. This overall average difference value is then used
to offset all of the yield values contained within each neighbouring region. Each adjusted region is then
locked and this whole process is iterated until eventually every region has had adjusted and locked.
The adjusted yield values are then saved in the output file's (--output) attribute table as a new field
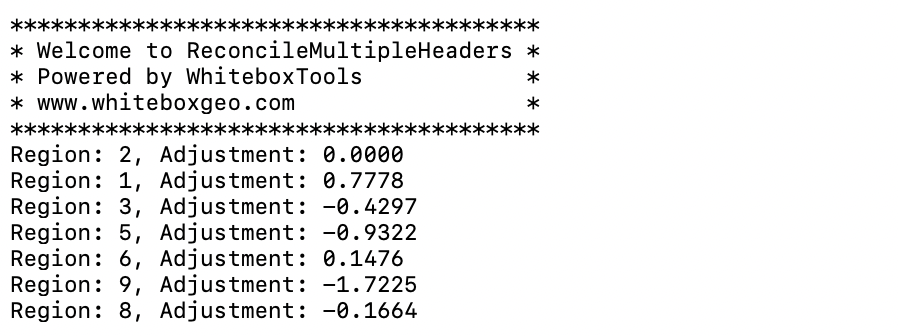
named ADJ_YIELD. The tool will also output a report that shows the offsets applied to each region
to calculate the adjusted yield values.
The user may optionally specify minimum and maximum allowable yield values (--min_yield and
--max_yield). Any points with yield values outside these bounds will not be included in the
point neighbourhood analysis for calculating region adjustments and will also not be included in the
output. The default values for this minimum and maximum yield values are the smallest non-zero
value and positive infinity respectively. Additionally, the user may optionally specify a mean overall
yield tonnage (--mean_tonnage) value. If specified, the output yield values will have one final
adjustment to ensure that the overall mean yield value equals this parameter, which should also be
between the minimum and maximum values, if specified. This parameter can be set by dividing the
actual measured tonnage taken off the field by the field area.
This tool can be used as a pre-processing step prior to applying the YieldFilter tool for fields collected with multiple headers. Note that some experimentation with the radius size may be necessary to achieve optimal results and that this parameter should not be less than the spacing between passes, but may be substantially larger. Also, difficulties may be encountered when regions are composed of multiple separated areas that are joined by a path along the edge of the field. This is particularly problemmatic when there exists a strong spatial trend, in the form of a yield graidient, within the field. In such cases, it may be necessary to remove edge points from the data set using the RemoveFieldEdgePoints tool.
See Also: YieldFilter, RemoveFieldEdgePoints, YieldMap, RecreatePassLines
Parameters:
| Flag | Description |
|---|---|
| -i, --input | Name of the input points shapefile |
| --region_field | Name of the attribute containing region data |
| -y, --yield_field | Name of the attribute containing yield data |
| -o, --output | Name of the output points shapefile |
| --radius | Optional search radius, in metres. Only specify this value if you want to calculate locally normalized yield |
| --min_yield | Minimum yield value in output |
| --max_yield | Maximum yield value in output |
| --mean_tonnage | Use this optional parameter to force the output to have a certain overall average tonnage |
Python function:
wbt.reconcile_multiple_headers(
    i,
    region_field,
    yield_field,
    output,
    radius=None,
    min_yield=None,
    max_yield=None,
    mean_tonnage=None,
    callback=default_callback
)
Command-line Interface:
>> ./whitebox_tools -r=ReconcileMultipleHeaders ^
-i=yield_points.shp --region_field='REGION' ^
--yield_field='YIELD' -o=filtered_points.shp --radius=12.0 ^
--min_yield=24.0 --max_yield=55.0 --mean_tonnage=35.5
Source code is unavailable due to proprietary license.
Author: Whitebox Geospatial Inc. (c)
Created: 17/08/2021
Last Modified: 22/08/2021
RecreatePassLines
Note this tool is part of a WhiteboxTools extension product. Please visit Whitebox Geospatial Inc. for information about purchasing a license activation key (https://www.whiteboxgeo.com/extension-pricing/).
This tool can be used to approximate the combine harvester swath pass lines from yield points. It is sometimes
the case that either pass-line information is not stored in the point data created during harvesting, or
that this information is lost. The YieldFilter and YieldMap tools however require information about the
associated swath path for each point in the dataset. This tool can therefore serve as a pre-processing
operation before running either of those more advanced mapping tools. It works by examining the geometry of
nearby points and associating points with line features that observe a maximum angular change in direction
(--max_change_in_heading). The tool creates two output vectors, including a pass line vector (--output) and
a points vector (--output_points). The points output contains a PASS_NUM field within its attribute tables
that indicate the unique identifier associated with features. The line vector output contains an AVGYIELD
attribute field, which provides the pass-line average of the input yield values (--yield_field_name).
For a video tutorial on how to use the RecreatePassLines, YieldFilter and YieldMap tools, see this YouTube video. There is also a blog that describes the usage of this tool on the WhiteboxTools homepage.
See Also: YieldFilter, YieldMap, ReconcileMultipleHeaders, RemoveFieldEdgePoints, YieldNormalization
Parameters:
| Flag | Description |
|---|---|
| -i, --input | Name of the input points shapefile |
| -y, --yield_field_name | Name of the attribute containing yield data |
| --output_lines | Name of the output pass lines shapefile |
| --output_points | Name of the output points shapefile |
| -m, --max_change_in_heading | Max change in heading |
| --ignore_zeros | Ignore zero-valued yield points? |
Python function:
wbt.recreate_pass_lines(
    i,
    yield_field_name,
    output_lines,
    output_points,
    max_change_in_heading=25.0,
    ignore_zeros=False,
    callback=default_callback
)
Command-line Interface:
>> ./whitebox_tools -r=RecreatePassLines -i=yield_points.shp ^
--yield_field_name='YIELD' -o=filtered_points.shp ^
--max_change_in_heading=25.0
Source code is unavailable due to proprietary license.
Author: Whitebox Geospatial Inc. (c)
Created: 24/05/2021
Last Modified: 18/06/2021
RemoveFieldEdgePoints
Note this tool is part of a WhiteboxTools extension product. Please visit Whitebox Geospatial Inc. for information about purchasing a license activation key (https://www.whiteboxgeo.com/extension-pricing/).
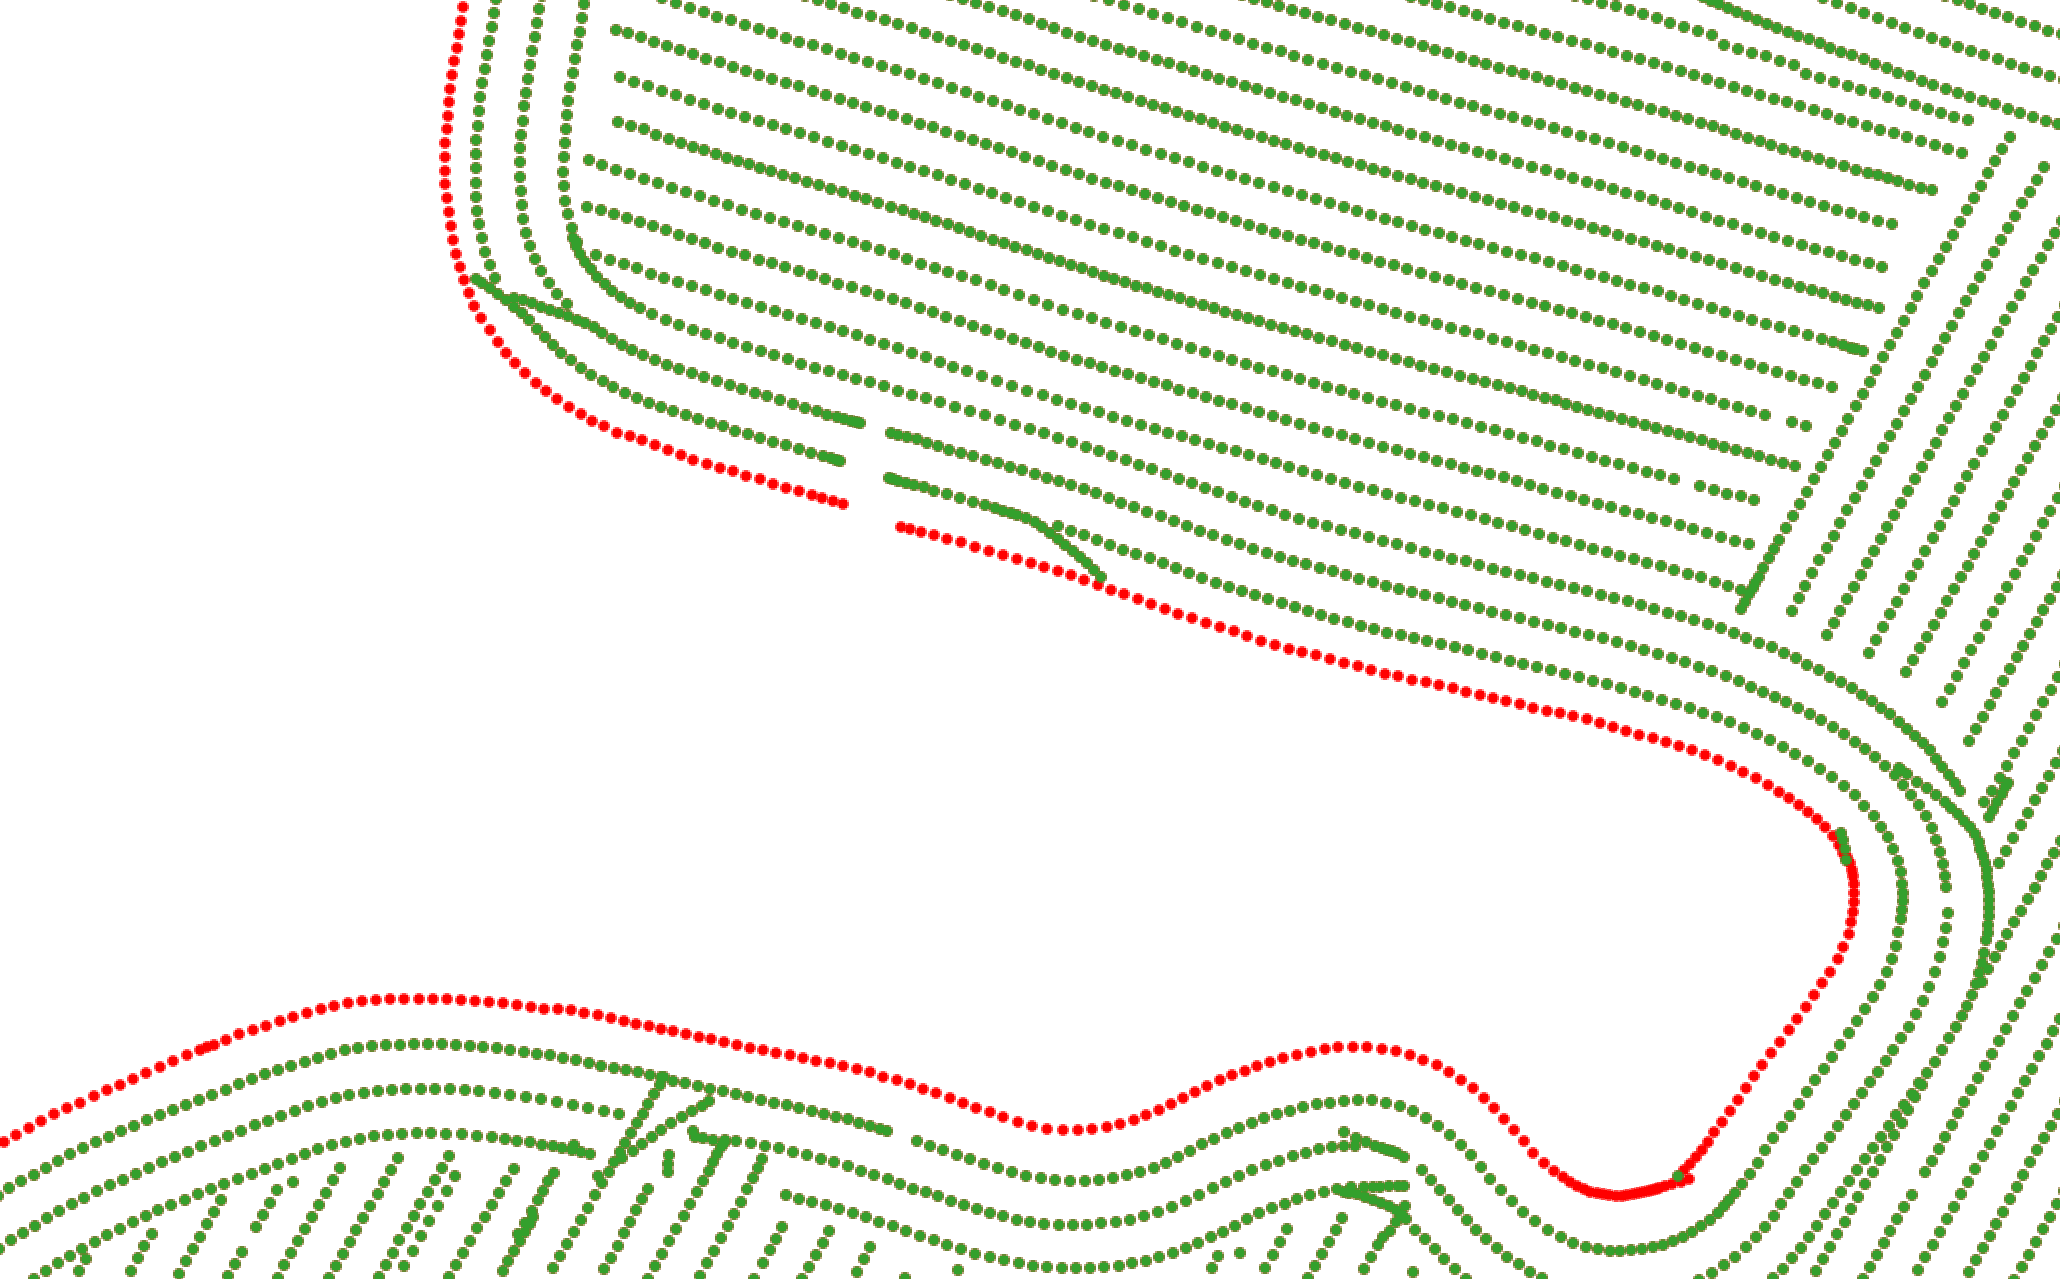
This tool can be used to remove, or flag, most of the points along the edges from a crop yield data set. It is frequently the case that yield data collected along the edges of fields are anomalous in value compared with interior values. There are many reasons for this phenomenon, but one of the most common is that the header may be only partially full.
The user must specify the name of the input vector yield points data set (--input), the output
points vector (--output), the average distance between passes (--dist), in meters, and the
maximum angular change in direction (--max_change_in_heading), which is used to map pass lines
(see also RecreatePassLines).
For a video tutorial on how to use the RemoveFieldEdgePoints tool, see this YouTube video.
See Also: YieldFilter, ReconcileMultipleHeaders, YieldMap, RecreatePassLines, YieldNormalization
Parameters:
| Flag | Description |
|---|---|
| -i, --input | Name of the input points shapefile |
| -o, --output | Name of the output points shapefile |
| -d, --dist | Average distance between passes, in meters |
| -m, --max_change_in_heading | Max change in heading |
| --flag_edges | Don't remove edge points, just flag them in the attribute table? |
Python function:
wbt.remove_field_edge_points(
    i,
    output,
    dist=None,
    max_change_in_heading=25.0,
    flag_edges=False,
    callback=default_callback
)
Command-line Interface:
>> ./whitebox_tools -r=RemoveFieldEdgePoints ^
-i=yield_points.shp -o=filtered_points.shp --dist=12.0 ^
--max_change_in_heading=25.0
Source code is unavailable due to proprietary license.
Author: Whitebox Geospatial Inc. (c)
Created: 19/08/2021
Last Modified: 19/08/2021
YieldFilter
Note this tool is part of a WhiteboxTools extension product. Please visit Whitebox Geospatial Inc. for information about purchasing a license activation key (https://www.whiteboxgeo.com/extension-pricing/).
This tool can be used to filter the crop yield values associated with point data derived from commerical combine harvester yield monitors. Crop yield data often suffer from high levels of noise do to the nature of how these data are collected. Commercial crop yield monitors on combine haresters are prone to erroneous data for several reasons. Where harvested rows overlap, lower than expected crop yields may be associated with the second overlapping swath because the head of the harvesting equipment is only partially filled. The edges of fields are particularly susceptible to being harvested without a full swath of crop, resulting in anomalous crop yields. The starts of new swaths are also prone to errors, because of the misalignment between the time when the monitor begins recording and the time when grain begins flowing. Sudden changes in harvester speed, either speeing up or slowing down, can also result in anomalous yield measurements.
The YieldFilter tool can smooth yield point patterns, particularly accounting for differences among adjacent
swath lines. The user must specify the name of the input points shapefile (--input), the name of the yield
attribute (--yield_field), the pass number attribute (--pass_field_name), the output file (--output), the
swatch width (combine head length, --width), the threshold value (--z_score_threshold), and optionally, minimum
and maximum yield values (--min_yield and --max_yield). If the input vector does not contain a field indicating
a unique identifier associated with each swath pass for points, users may use the RecreatePassLines to estimate
swath line structures within the yield points. The threshold value, measured in standardized z-scores
is used by the tool to determine when a point is replaced by the mean value of nearby points in adjacent swaths.
The output vector will contain the smoothed yield data in the attribute table in a field named AVGYIELD.
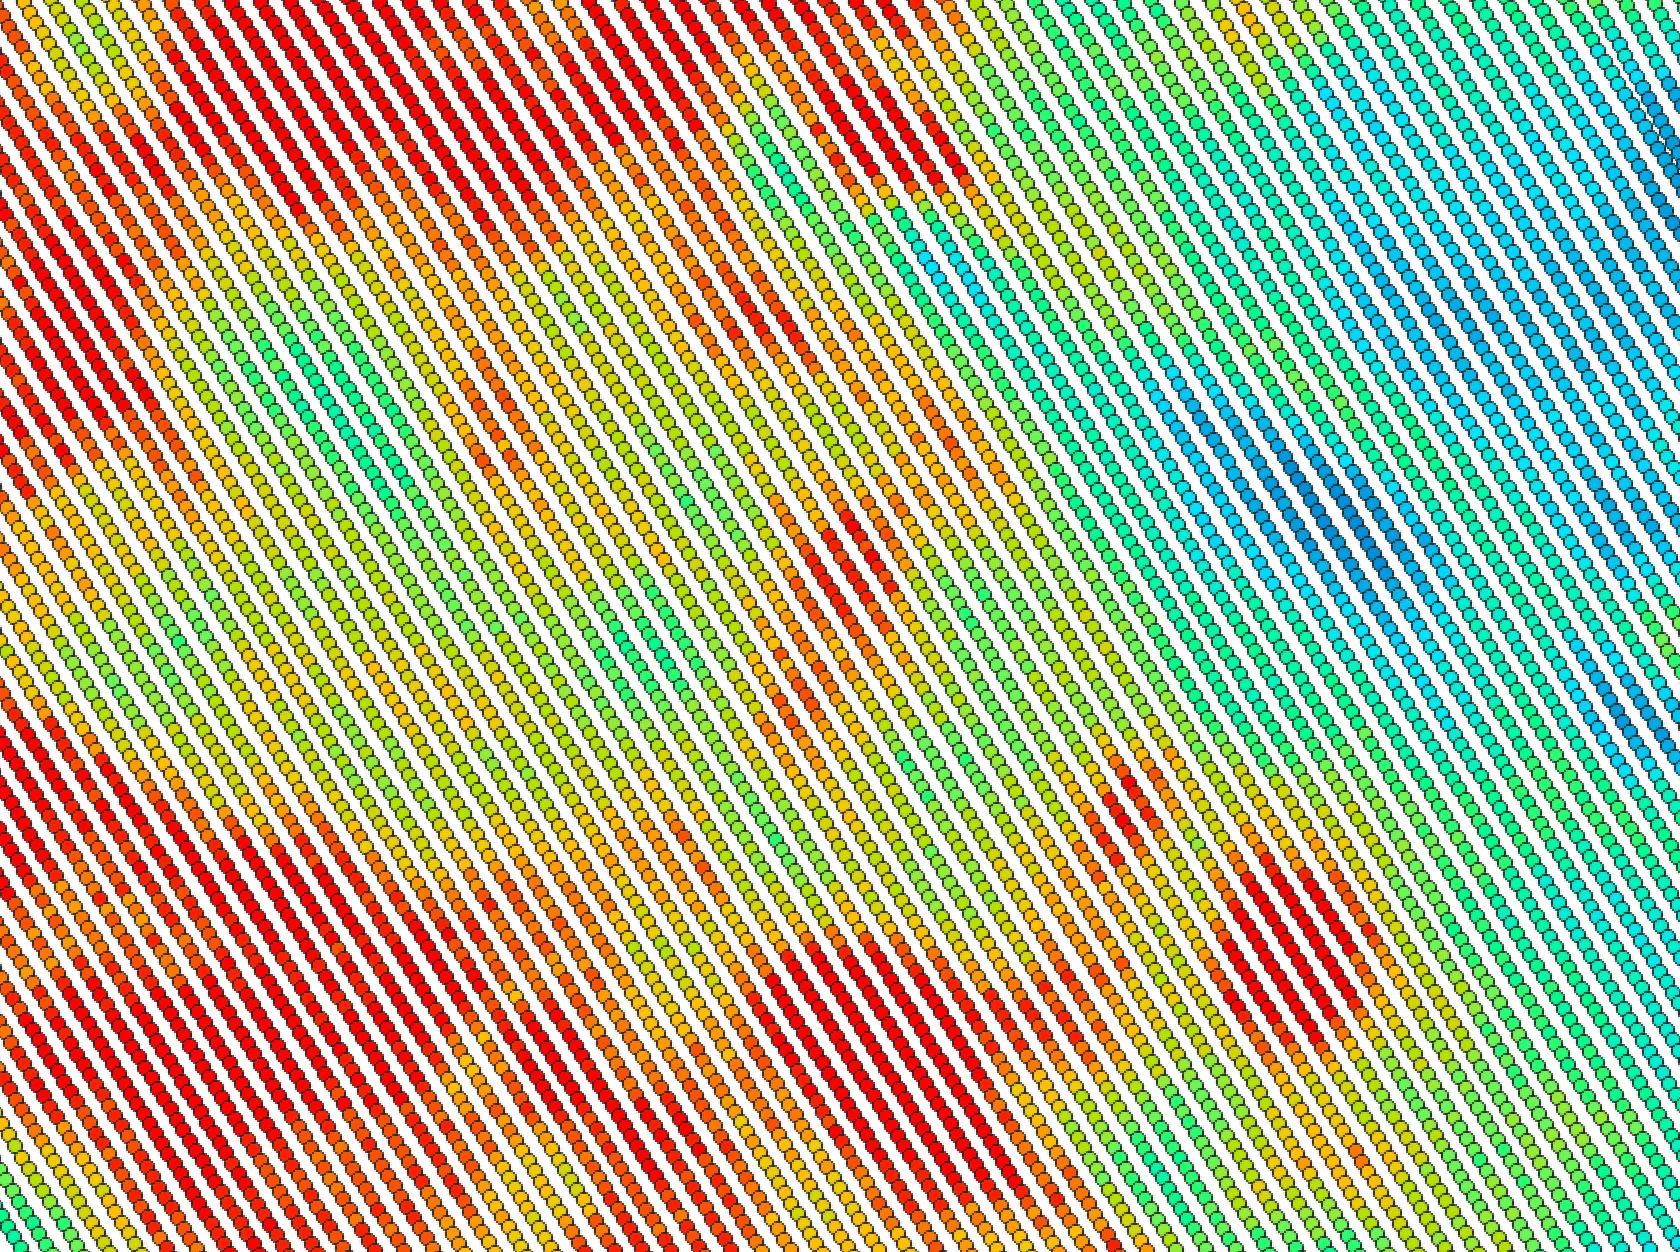
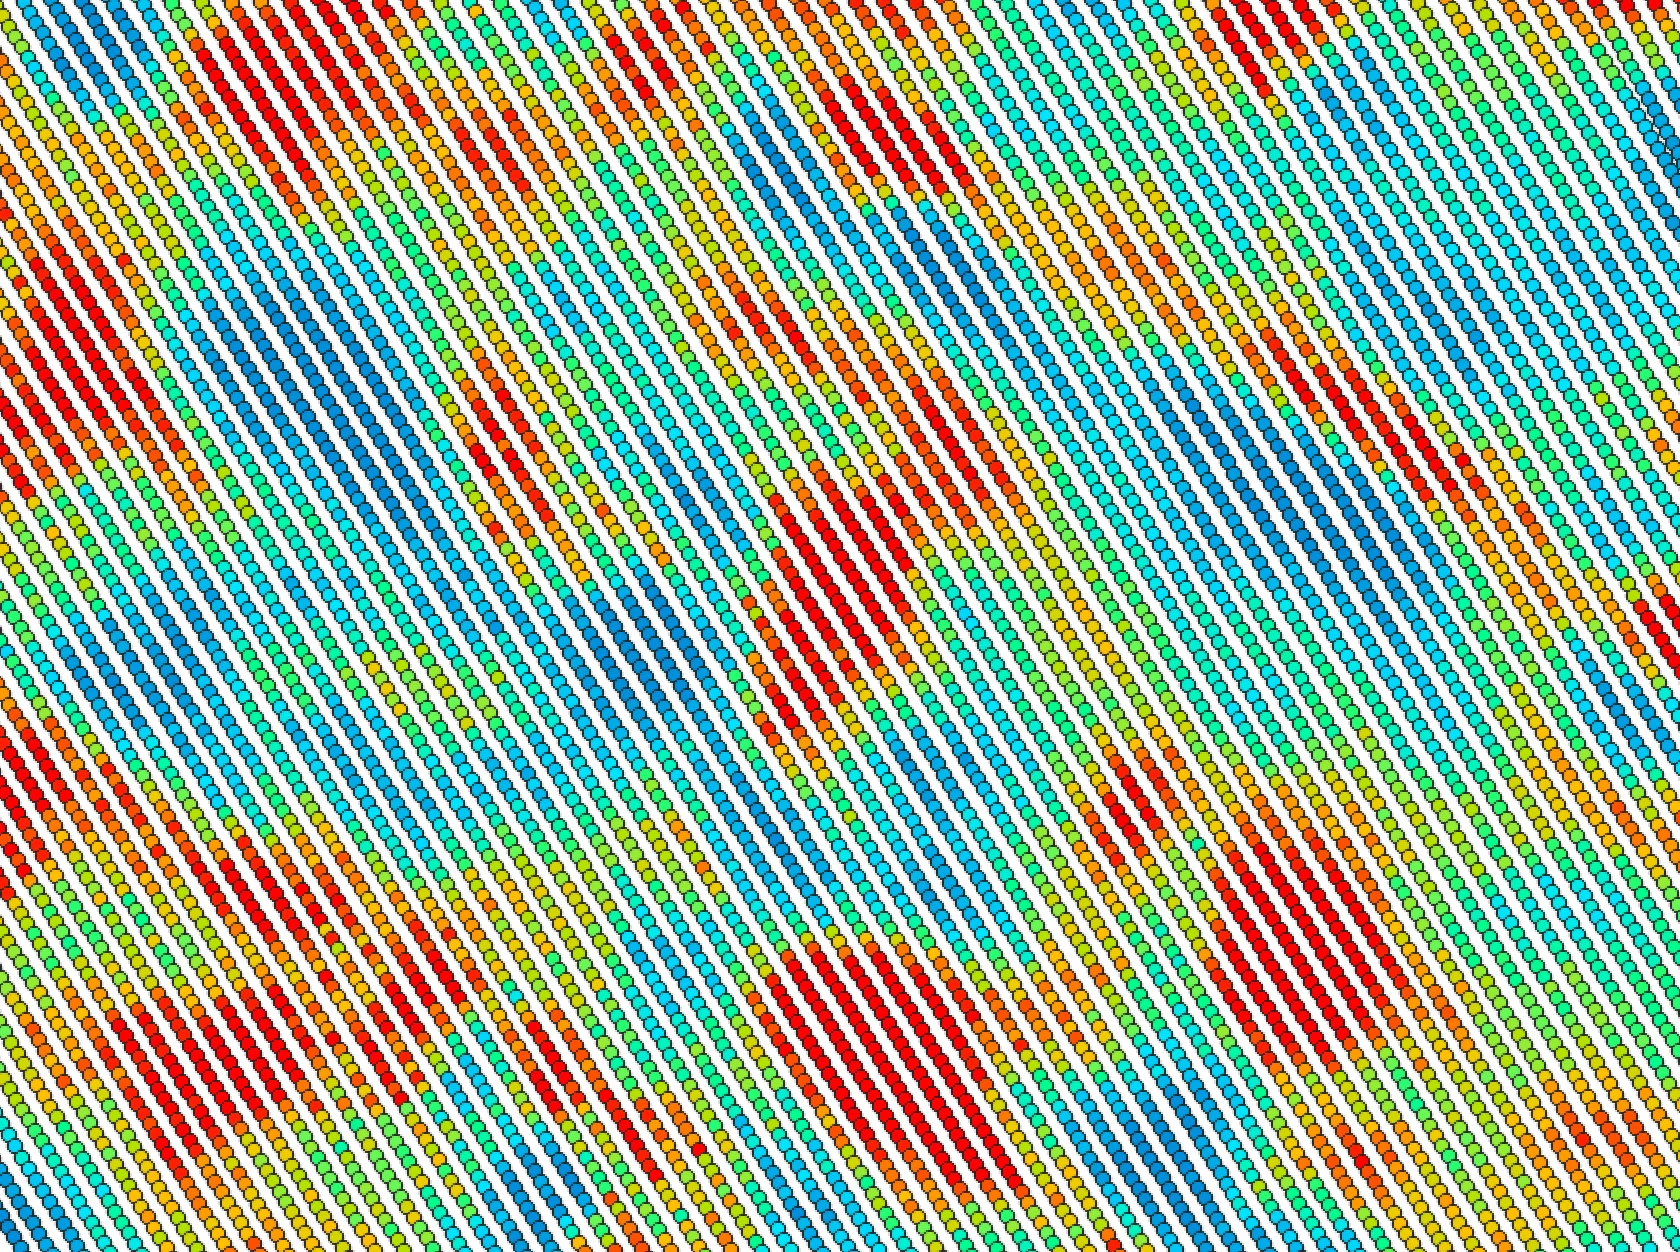
The following images show before and after examples of applying YieldFilter:

For a video tutorial on how to use the RecreatePassLines, YieldFilter and YieldMap tools, see this YouTube video. There is also a blog that describes the usage of this tool on the WhiteboxTools homepage.
See Also: RecreatePassLines, YieldMap, ReconcileMultipleHeaders, RemoveFieldEdgePoints, YieldNormalization
Parameters:
| Flag | Description |
|---|---|
| -i, --input | Name of the input points shapefile |
| -y, --yield_field | Name of the attribute containing yield data |
| -p, --pass_field | Name of the attribute containing pass line ID |
| -o, --output | Name of the output points shapefile |
| -w, --width | Pass swath width (m) |
| -z, --z_score_threshold | Z-score threshold value (default=2.5) |
| --min_yield | Minimum yield value in output |
| --max_yield | Maximum yield value in output |
Python function:
wbt.yield_filter(
    i,
    yield_field,
    pass_field,
    output,
    width=6.096,
    z_score_threshold=2.5,
    min_yield=0.0,
    max_yield=99999.9,
    callback=default_callback
)
Command-line Interface:
>> ./whitebox_tools -r=YieldFilter -i=yield_points.shp ^
--yield_field_name='YIELD' --pass_field_name='PASS_NUM' ^
-o=filtered_points.shp --width=7.0 --z_score_threshold=3.0 ^
--max_yield=55.0
Source code is unavailable due to proprietary license.
Author: Whitebox Geospatial Inc. (c)
Created: 25/05/2021
Last Modified: 25/05/2021
YieldMap
Note this tool is part of a WhiteboxTools extension product. Please visit Whitebox Geospatial Inc. for information about purchasing a license activation key (https://www.whiteboxgeo.com/extension-pricing/).
This tool can be used to create a segmented-vector polygon yield map from a set of harvester points. The user
must specify the name of the input points shapefile (--input), the pass number attribute (--passFieldName),
the output file (--output), the swatch width (combine head length, --width), and maximum angular change
in direction (--maxChangeInHeading). If the input vector does not contain a field indicating
a unique identifier associated with each swath pass for points, users may use the RecreatePassLines to estimate
swath line structures within the yield points.
For a video tutorial on how to use the RecreatePassLines, YieldFilter and YieldMap tools, see this YouTube video. There is also a blog that describes the usage of this tool on the WhiteboxTools homepage.
See Also: RecreatePassLines, YieldFilter, ReconcileMultipleHeaders, RemoveFieldEdgePoints, YieldNormalization
Parameters:
| Flag | Description |
|---|---|
| -i, --input | Name of the input points shapefile |
| -p, --pass_field_name | Name of the attribute containing pass line ID |
| -o, --output | Name of the output polygon shapefile |
| -w, --width | Pass swath width (m) |
| -m, --max_change_in_heading | Max change in heading |
Python function:
wbt.yield_map(
    i,
    pass_field_name,
    output,
    width=6.096,
    max_change_in_heading=25.0,
    callback=default_callback
)
Command-line Interface:
>> ./whitebox_tools -r=YieldMap -i=points.shp -p='PASS_NUM' ^
-o=yield_map.shp --width=7.0 --max_change_in_heading=25.0
Source code is unavailable due to proprietary license.
Author: Whitebox Geospatial Inc. (c)
Created: 25/05/2021
Last Modified: 25/05/2021
YieldNormalization
Note this tool is part of a WhiteboxTools extension product. Please visit Whitebox Geospatial Inc. for information about purchasing a license activation key (https://www.whiteboxgeo.com/extension-pricing/).
This tool can be used to normalize the crop yield values (--yield_field) in a coverage of vector points
(--input) derived from a combine harvester for a single agricultural field. Normalization is the process of
modifying the numerical range of a set of values. Normalizing crop yield values is a common pre-processing
procedure prior to analyzing crop data in either a statistical model or machine learning based analysis.
The tool re-scales the crop yield values to a 0.0-1.0 range based on the minimum and maximum values, storing
the rescaled yield data in an attribute field (named NORM_YIELD)) in the output vector file (--output).
The user may also specify custom minimum and maximum yield values (--min_yield and --max_yield); any crop
yield values less than this minimum or larger than the specified maximum will be assigned the boundary values,
and will subsequently define the 0.0-1.0 range.
The user may also optionally choose to standardize (--standardize), rather than normalize the data. See
here for
a detailed description of the difference between these two data re-scaling methods. With this
option, the output yield values (stored in the STD_YIELD field of the output vector attribute table) will be
z-scores, based on differences from the mean and scaled by the
standard deviation.
Lastly, the user may optionally specify a search radius (--radius), in meters. Without this optional parameter, the
normalization of the data will be based on field-scale values (min/max, or mean/std. dev.). However, when
a radius value larger than zero is specified, the tool will perform a regional analysis based on the points
contained within a local neighbourhood. The radius value should be large enough to ensure that at least
three point measurements are contain within the neighbourhood surrounding each point. Warnings will be issued
for points for which this condition is not met, and their output values will be set to -99.0. When this warning
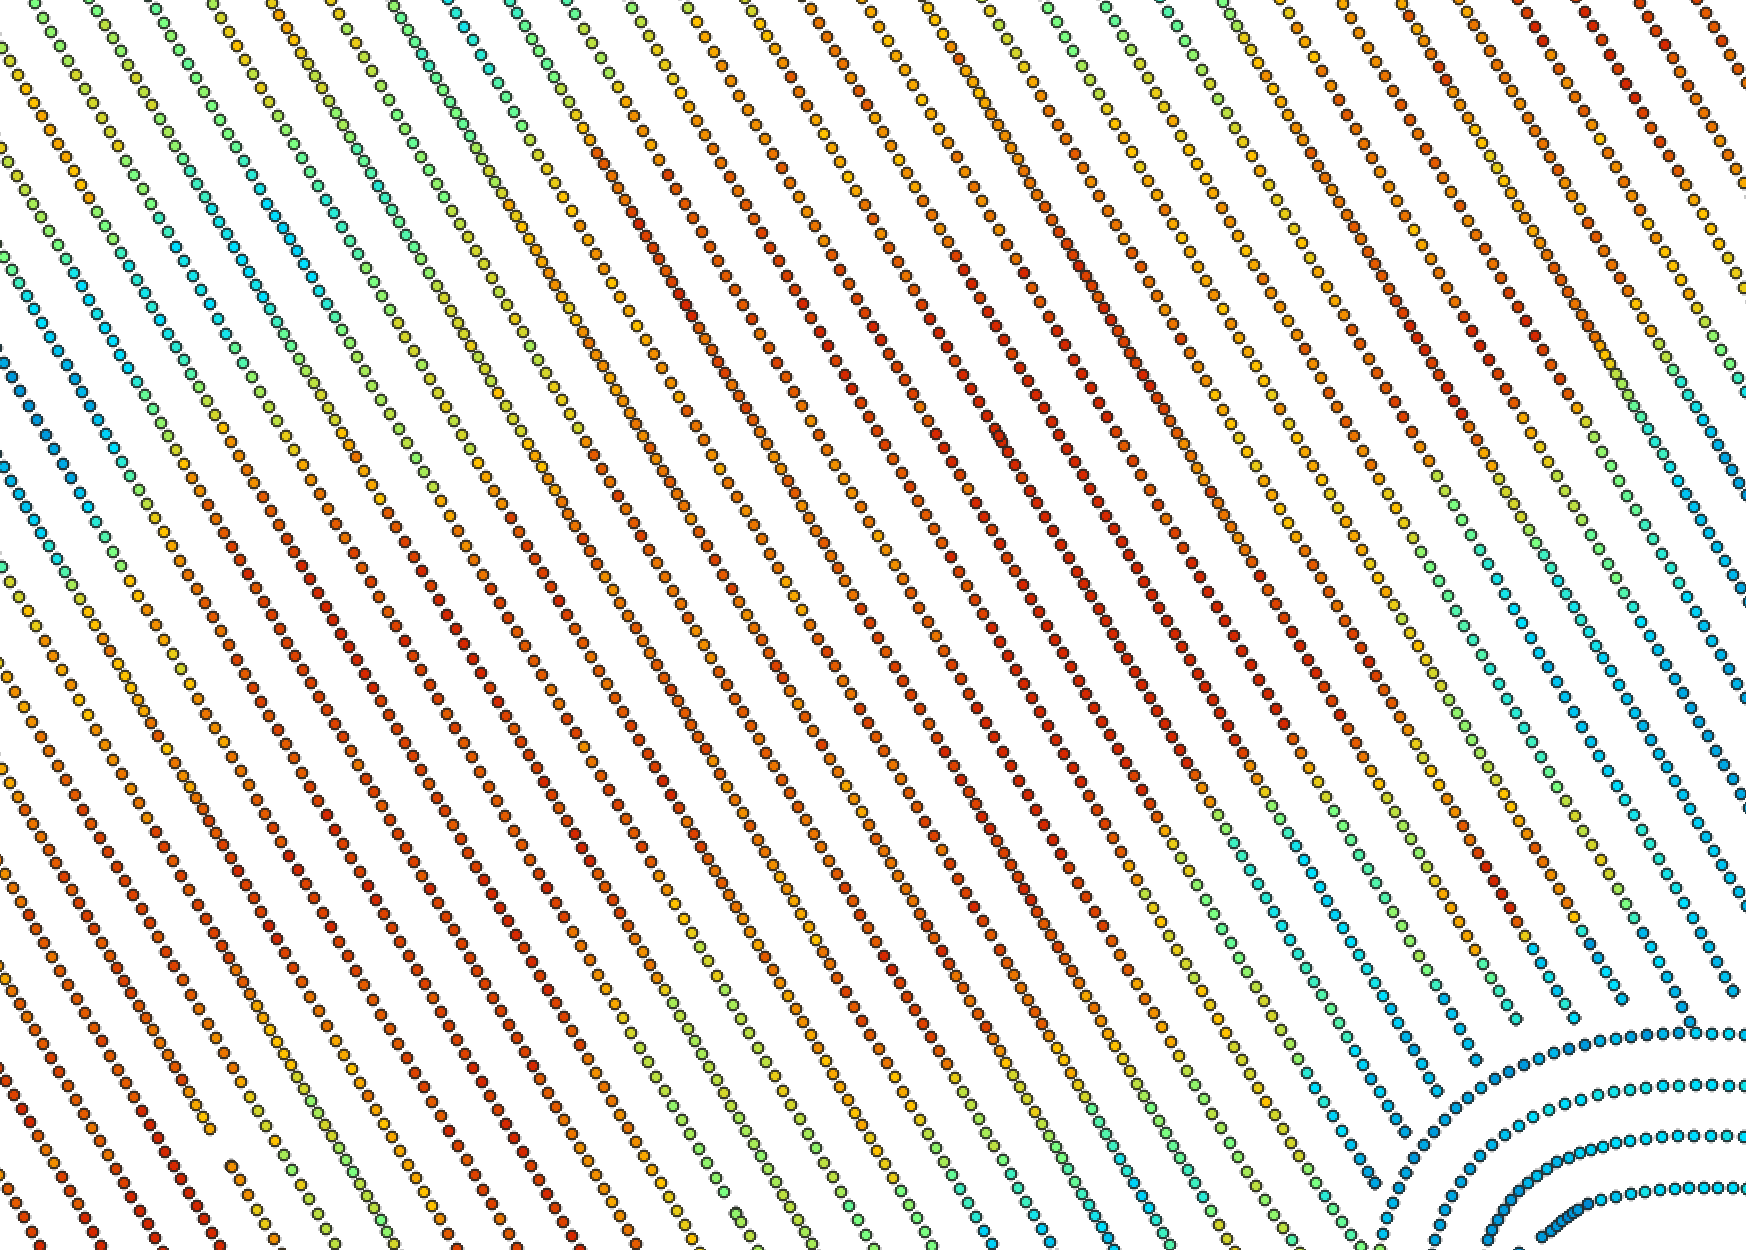
occurs frequently, you should consider choosing a larger search radius. The following images demonstrate the
difference between field-scale and localized normalization of a sample yield data set.
Like many other tools in the Precision Agriculture toolbox, this tool will work with input vector points files in geographic coordinates (i.e. lat/long), although it is preferable to use a projected coordinate system.
See Also: YieldMap, YieldFilter, RecreatePassLines, ReconcileMultipleHeaders, RemoveFieldEdgePoints
Parameters:
| Flag | Description |
|---|---|
| -i, --input | Name of the input points shapefile |
| -y, --yield_field | Name of the attribute containing yield data |
| -o, --output | Name of the output points shapefile |
| --standardize | Should the yield values be standardized (converted to z-scores) rather than normalized? |
| --radius | Optional search radius, in metres. Only specify this value if you want to calculate locally normalized yield |
| --min_yield | Minimum yield value in output |
| --max_yield | Maximum yield value in output |
Python function:
wbt.yield_normalization(
    i,
    yield_field,
    output,
    standardize=False,
    radius=None,
    min_yield=0.0,
    max_yield=99999.9,
    callback=default_callback
)
Command-line Interface:
>> ./whitebox_tools -r=YieldNormalization -i=yield_points.shp ^
--yield_field='YIELD' -o=filtered_points.shp --standardize ^
--radius=12.0 --min_yield=24.0 --max_yield=55.0
Source code is unavailable due to proprietary license.
Author: Whitebox Geospatial Inc. (c)
Created: 20/06/2021
Last Modified: 21/06/2021