Adding a splash of colour to the lunar surface

lunar topography detailed snapshot

You may have heard, we’re heading back to the moon! This week, NASA successfully launched the Artemis-1 rocket, the vehicle that is intended to bring people back to the moon after decades of absenteeism, with plans to eventually build a permanent moon base. Well to celebrate this wonderful achievement of humanity (and of course, all of the tremendous scientists and personnel of the various space agencies involved), I decided to create a multi-scale topographic image of the lunar surface. Earlier this week, I tweeted little snapshots of this image, but given the limited format of that platform, I could not provide a full-extent image. Well folks, here it is, by popular request!

Lunar multi-scale topography image
Click on the image for a higher-resolution version

Actually, the image above is just a low-res version that is the maximum size that WordPress would allow me to upload. But if you click on the image, you will be brought to a version of it that is much higher resolution. But be warned, it’s a big image at 355MB! The other warning is that there’s a significant risk you’ll spend substantial time scrolling through this beautiful image, lost in the gorgeous detail of it. In truth, even this image is not the full resolution version that I computed, which was over 2GB in size! I figured that would be far too large to make publicly available, at least on the www.whiteboxgeo.com servers. For those of you who are struggling to open the higher-resolution image above, here’s a 1/6th resolution image (48MB) that’s still pretty nice to look at!

Here are some samples of the full-resolution image, if you care to see:

lunar topography detailed snapshot

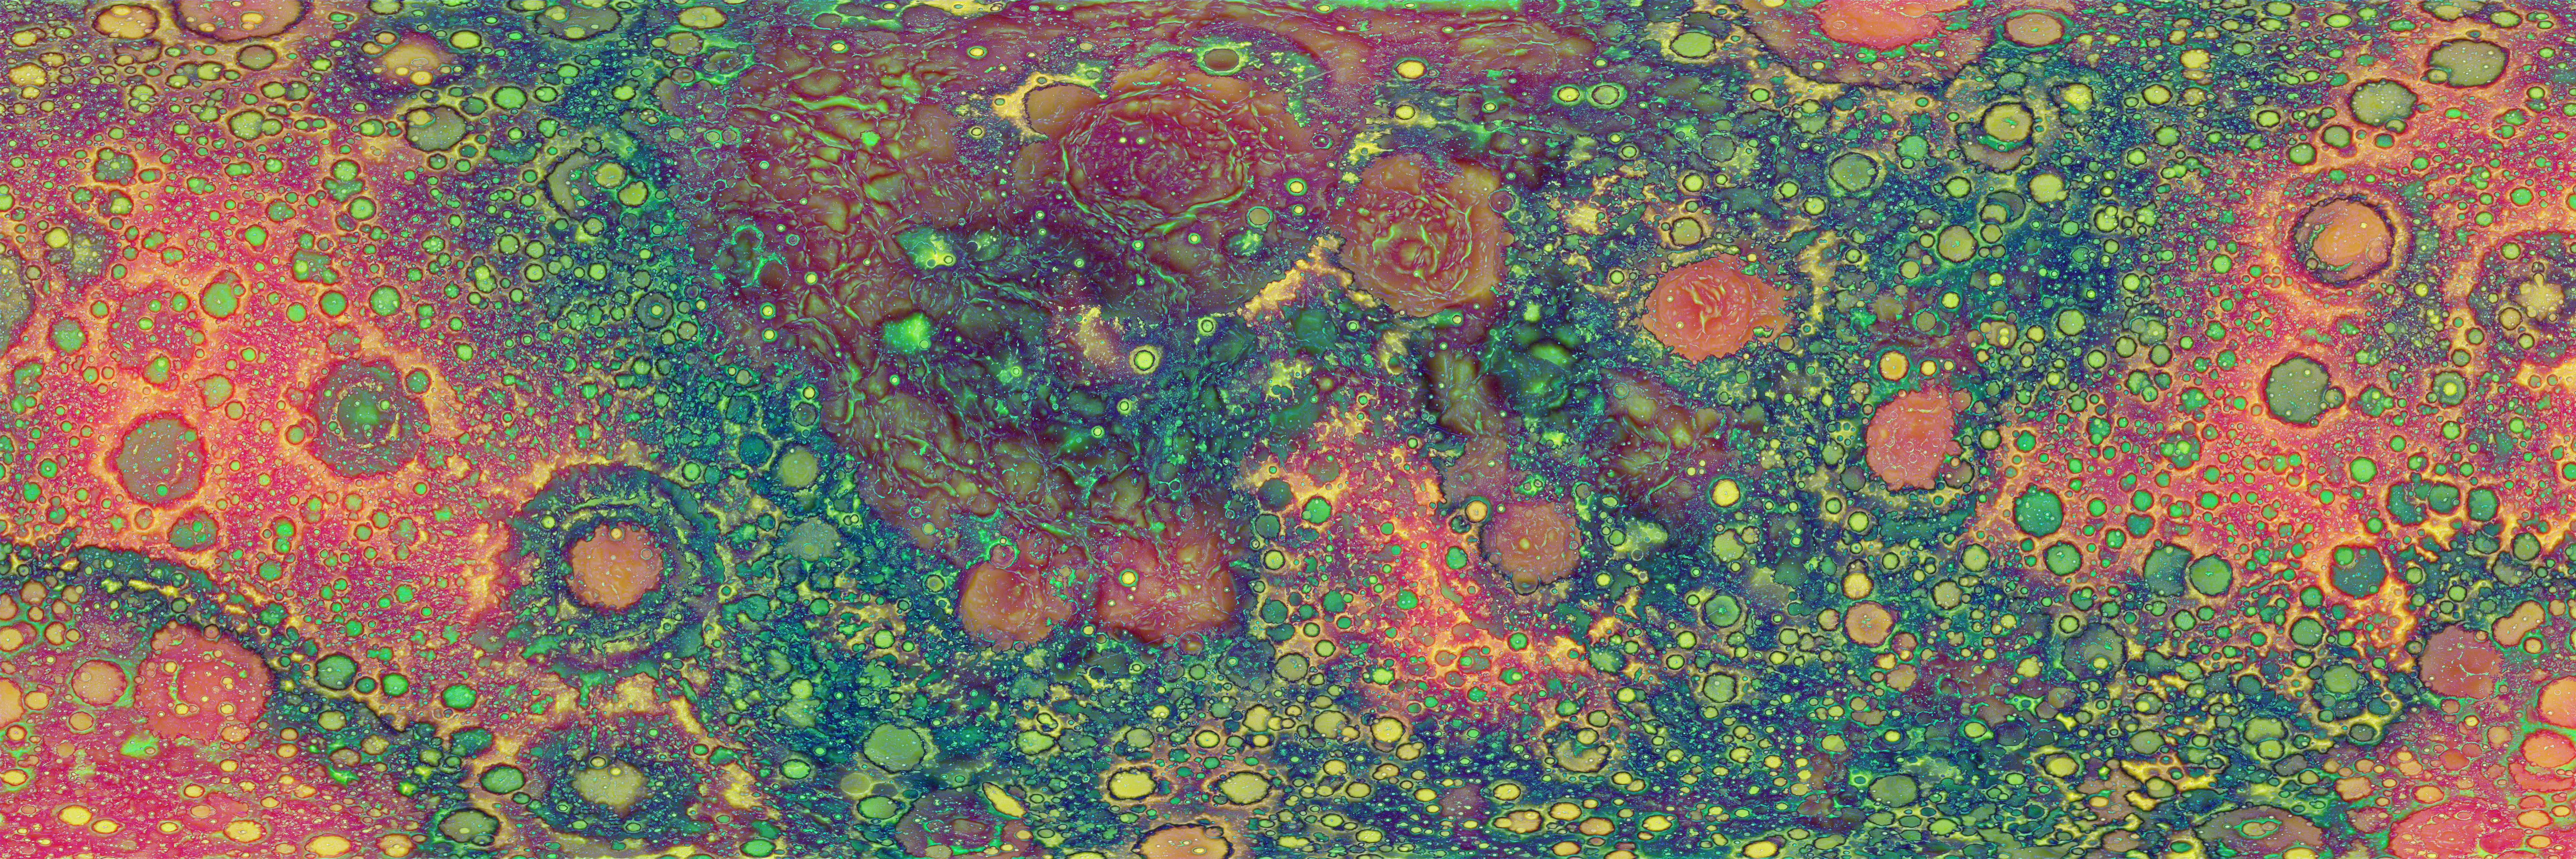
Imagine if our moon looked like this! That would be quite the show every night. It would be hard to look past the moon to see the stars.

Okay, so what’s going on here? How did I create this remarkable image and how and why does it work? Let’s answer that last part first and then go back to the specifics of how the image was created.

The lunar surface is very complex. Without an atmosphere, the moon doesn’t have active denudation processes, like erosion, deposition, and weathering, to the extent that the earth does. And so every topography forming event (geological and meteor impact) is perfectly preserved from the moment of their creation. Furthermore, each of these topographic features are superimposed on top of others all at varying scales. That level of topographic detail can be very difficult for the human visual system to interpret. What I’ve done in creating this image is to separate the various scales of topographic variability (local scale, meso scale, and broad scale ranges) by taking advantage of the fact that your visual system is so well tuned to interpret colour information. Essentially, I have channelled the fine-scale topographic variation into the blue colours, the middle-scales of variation into the greens, and the broadest scales of topography into the reds.

This is a process of visualizing topography in complex terrains that I developed in a paper published in Geomorphology in 2015. I refer to these visualizations as multiscale topographic position images (MSTP images). To understand what is happening in the process you have to first understand how I’m isolating topographic variability in various scale ranges. I’m using a land-surface parameter known as deviation from mean elevation (DEV), essentially a standardized version of difference from local mean value (DIFF), i.e. simply the difference in elevation between each point and the average elevation of its neighbourhood of a certain size. However, that standardization of the parameter is quite important to the process and helps with layering information from different scales effectively. If we didn’t standardize, the image would be dominated by the large scale, since relief generally increases with scale.

The other notable thing is that I’m not simply measuring DEV at three single scales, local, meso and broad, and then creating a colour composite from those. No, that wouldn’t be particularly effective because there is so much variability across such a wide range of spatial scales that only sampling three single scales of scale space wouldn’t capture nearly the level of detail required. Each of the three ‘scale composites’ are actually scale mosaics, where each grid cell has had the DEV value for each of the three wide scale ranges measures at a characteristic scale based on the unique setting of that site. The characteristic scale, within a wide scale range, is the one associated with the maximum absolute DEV value, something that I refer to as DEVmax. I am effectively measuring the scale-signature of DEV for each grid cell, parsing that signature into three broad scale ranges and finding key scales to represent the red, green, and blue components of each pixel. Here’s a figure that illustrates how a DEVmax scale mosaic is calculated:

How a scale mosaic of a land-surface parameter is calculated

DEVmax is a measure of how anomalous (i.e. elevated or low-lying) a location is relative to its surroundings across a range of scales. Because the colour composite uses the absolute value of DEVmax, ultimately elevated and low-lying sites are treated similarly; the more intense the colour is in the image, the more anomalous that site is (either elevated or low-lying), and the hue of the colour indicates at which spatial scale range the site is most anomalous (blue=local, green=meso, and red=broad). Of course, you can also have combinations: a site that is anomalously situated at both the meso and broad scales (e.g. a medium sized crater on a broad rise of topography) will be brightly yellow coloured, etc.

Here is an example of the three DEVmax scale mosaics that were used to create the lunar topographic map above:

Local scale DEVmax image (blue), derived with a scale range of 10-65 grid cells (1/128 of a degree resolution)
Meso scale DEVmax image (green), derived with a scale range of 100-1000 grid cells (1/128 of a degree resolution)
Broad scale DEVmax image (red), derived with a scale range of 5000-50000 grid cells (1/128 of a degree resolution)

Lastly, regarding the software used to create the image, it was obviously WhiteboxTools that I used! Specifically, the three component DEVmax images were created using the MaxElevationDeviation tool using the scale ranges noted above (I experimented with scale ranges and sampling density, as appropriate values will be somewhat dependent on the data set). I used the MultiscaleTopographicPositionImage to create the final image. Lastly, I also used the MultidirectionalHillshade tool (with the full 360-degree option) to provide a overlaid shaded relief effect to make the final image pop that much more. My source DEM file was derived from the High-resolution Lunar Topography (SLDEM2015) data set. Specifically I used the 128 pixels per degree data set. I could have used the higher 256 or 512 pixels/degree versions, but I left that for another day. That’s it! All of this was derived using freely available data and some wonderfully powerful open-source software.

Leave a Comment

Your email address will not be published. Required fields are marked *